First, let’s take a look at the dynamic topology map effect of Zabbix:
Creating Dynamic Network Topology Maps with Zabbix
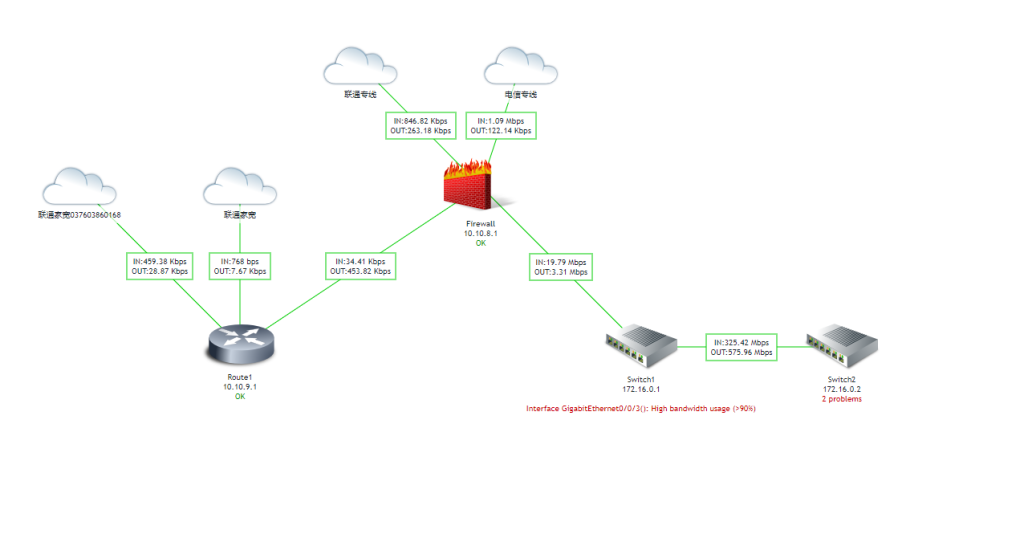
Monitoring network status is a routine task in operations and maintenance. Manual detection is too cumbersome, but now many experts have developed many useful tools that are not only visually appealing but also very practical.
In this issue, I will first write about the commonly used Zabbix to create dynamic network topology maps.
It’s actually quite simple, but the problem I encountered was with the company’s firewall. I couldn’t find the corresponding template on Zabbix, so I used the MIB library to load it. However, loading the MIB library file troubled me for several days because there isn’t much relevant information online, and most of the methods are wrong. I will write about the method of loading MIB library files to achieve monitoring in a few days. Here, I will first write about the devices that Zabbix can directly add.
Let’s start with the main content. After CentOS7, CentOS is no longer a stable version, so now we use the Rocky system. Regarding whether to install Zabbix directly into the system or use Docker, it is recommended to install it directly into the system for production environments.
Step 1: Install Zabbix
The following steps are based on the Rocky system. It is recommended to directly refer to the official documentation. The installation steps are very simple. On the official download page, select the system and version to install, and the installation steps will be automatically generated. Just follow the steps.
Creating Dynamic Network Topology Maps with Zabbix
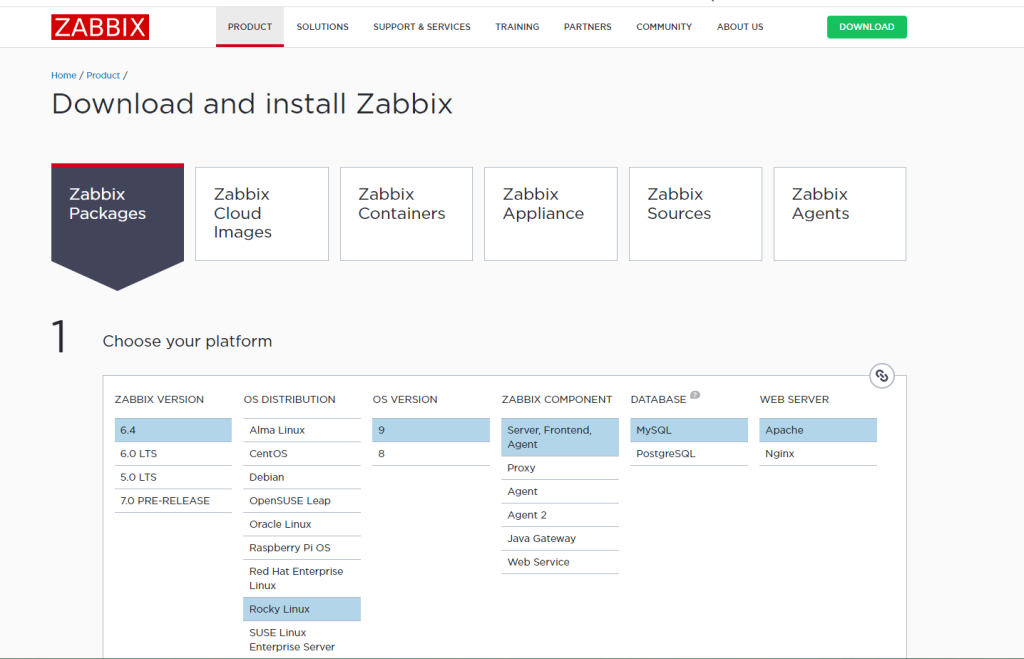
Creating Dynamic Network Topology Maps with Zabbix
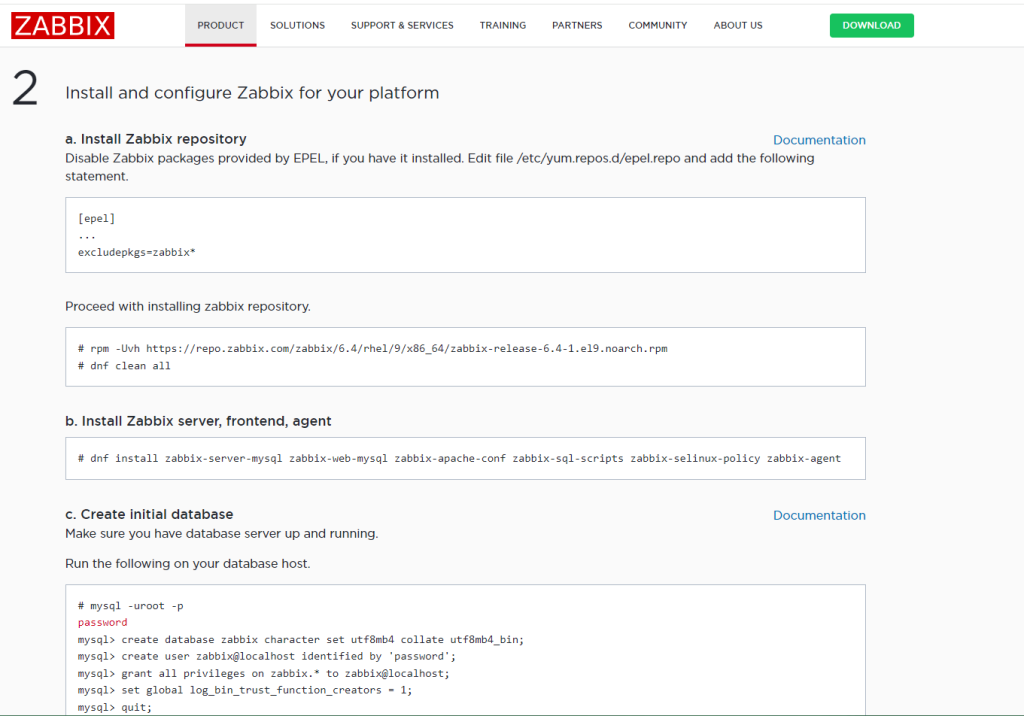
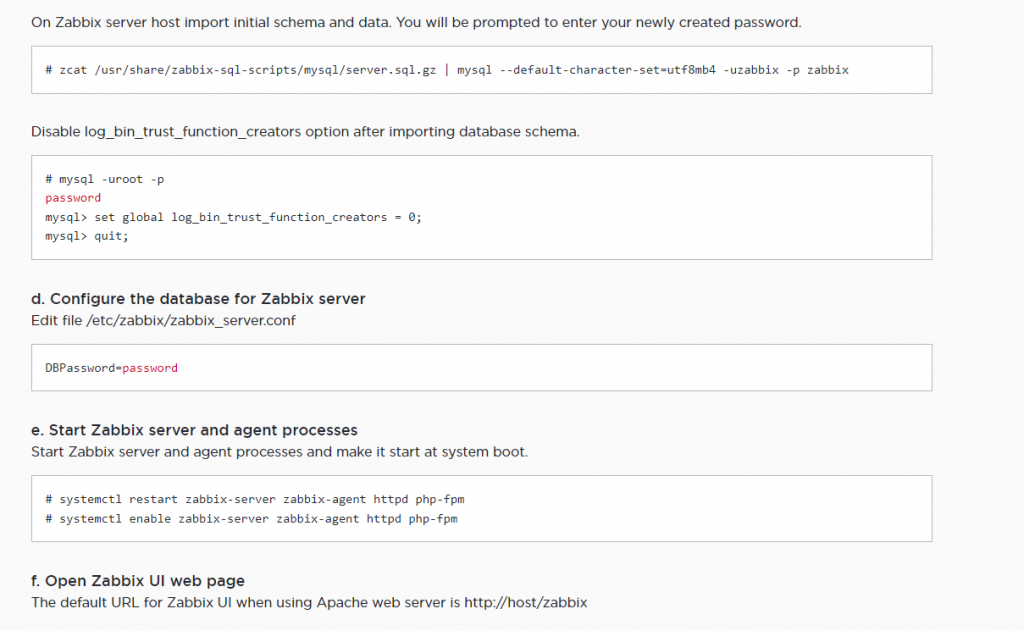
Creating Dynamic Network Topology Maps with Zabbix
Zabbix Official Reference Manual
Step 2: Disable the local firewall
systemctl stop firewalld
systemctl disable firewalld
Step 3: Access the web page
Since I have already installed it, I won’t show the screenshot here. Open http://IP:port, and you will enter the Zabbix initialization page. Enter the database password. The database connection password in the official documentation is password.
Step 4: Add monitored hosts
The monitored hosts need to enable SNMP and set the community string information. Since different devices have different methods to enable SNMP, this article takes the Huawei S5700 switch as an example. Enter the following commands in the terminal to enable the SNMP service:
snmp-agent
snmp-agent sys-info version v2c
snmp-agent community complexity-check disable
snmp-agent community read cipher read
snmp-agent trap enable
snmp-agent protocol source-status all-interface
Here, snmp-agent community read cipher read sets the SNMP connection password to read. For actual use, it is recommended to set a more complex password for security.
After enabling, add the host in Zabbix as shown below:
Creating Dynamic Network Topology Maps with Zabbix
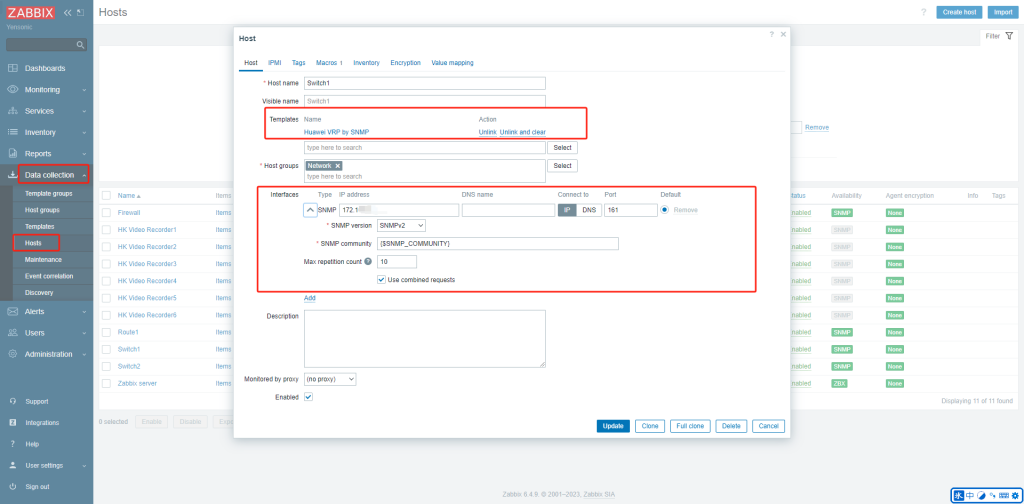
When adding a host, select the template, search for Huawei, and select the appropriate one. Then enter the corresponding SNMP password in the macro.
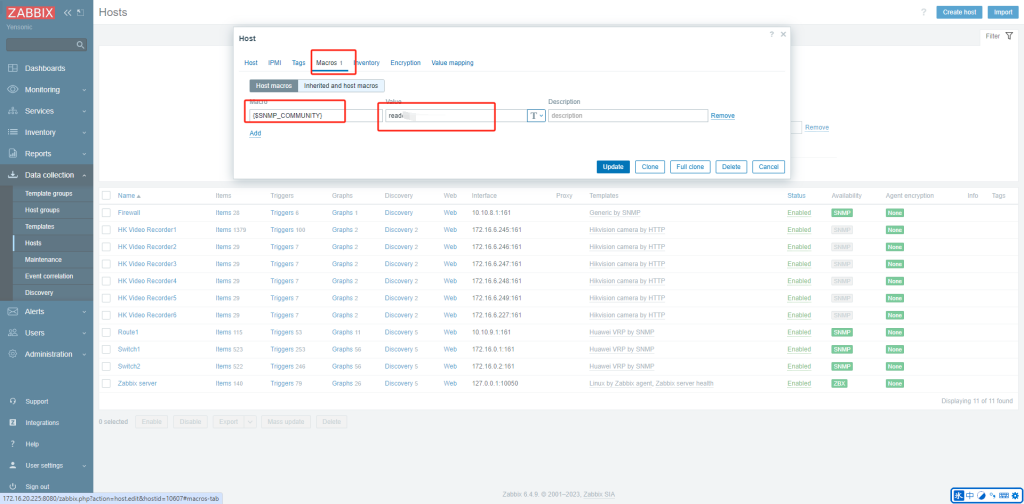
Creating Dynamic Network Topology Maps with Zabbix
After adding the host, if the SNMP status shows green, it has been added successfully. Add the hosts that need to be monitored one by one.
Step 5: Create a topology map
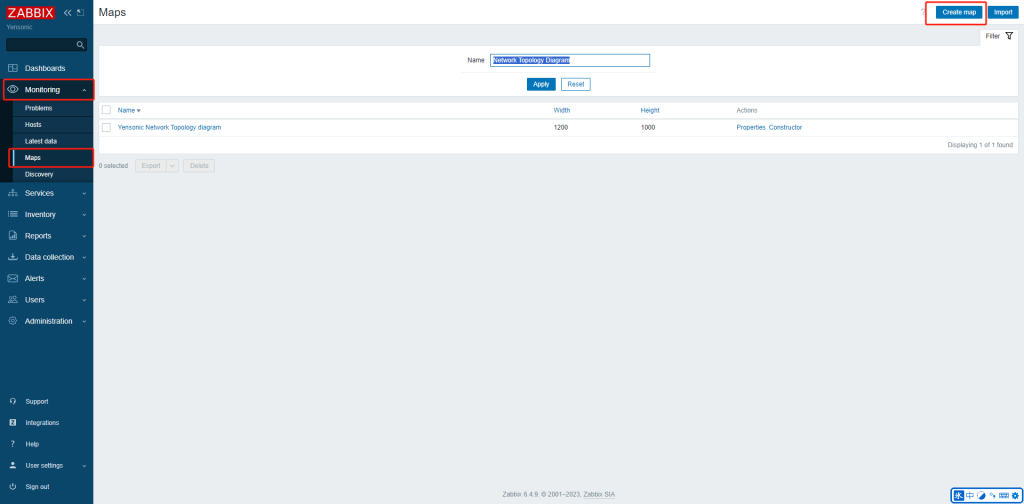
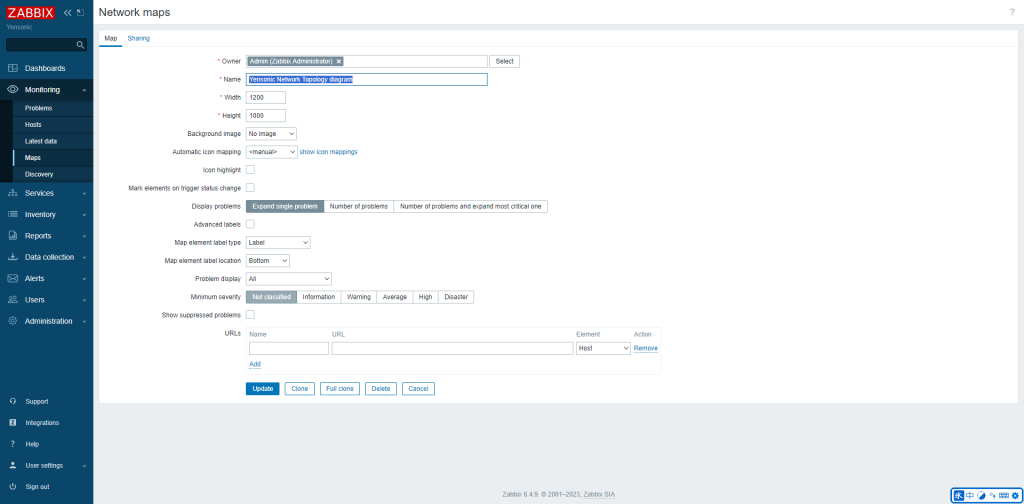
Then, add the corresponding device elements and icons inside and connect them.
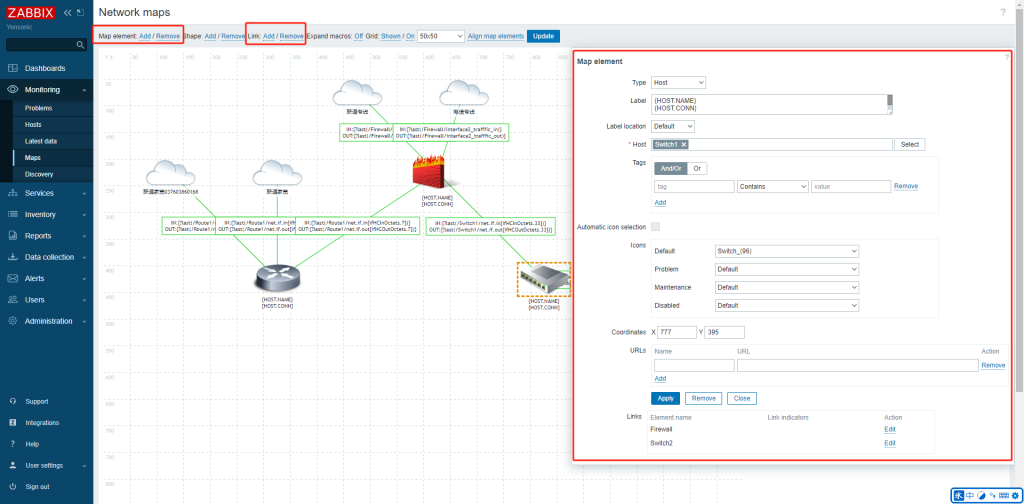
Modify the labels in the links to achieve dynamic display.
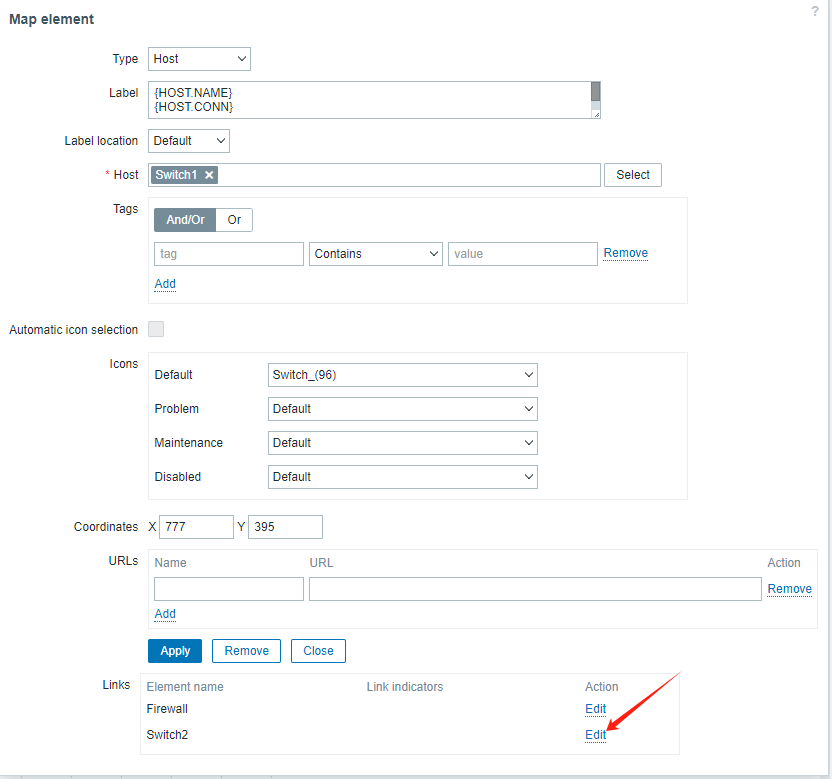
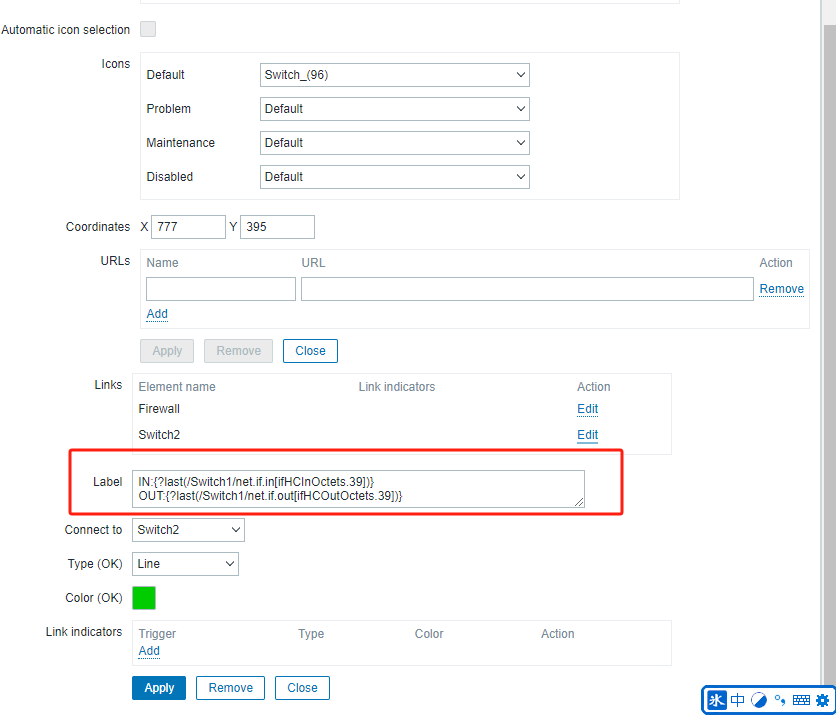
The writing method of Zabbix 6.4 is somewhat different from before. The format here is as shown in the figure:
IN:{?last(/Switch1/net.if.in[ifHCInOctets.39])}
OUT:{?last(/Switch1/net.if.out[ifHCOutOctets.39])}
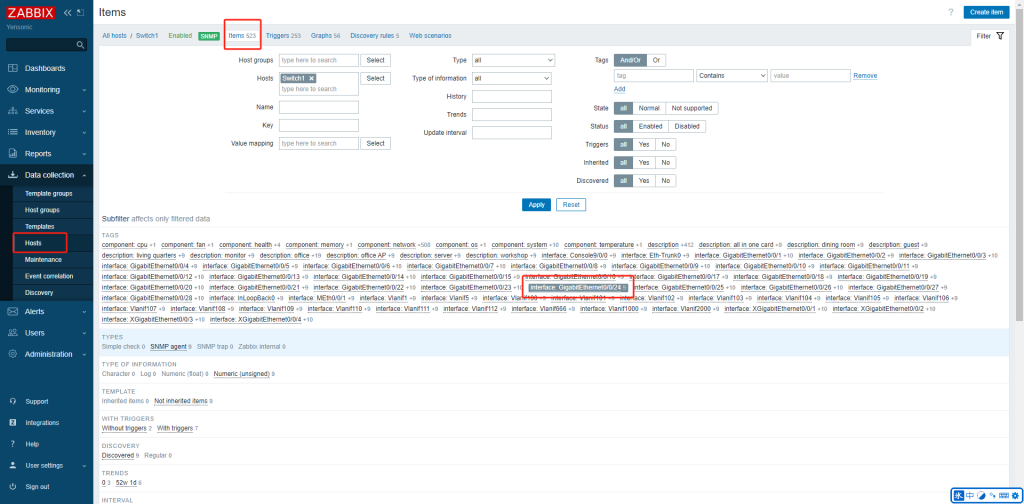
To explain the above script, the content inside {} is the script, the front part is the label, which can be written arbitrarily, and the format inside is fixed. ?last queries the latest value, and (/Switch1/net.if.out[ifHCOutOctets.39]) is /device name/output interface[interface number], corresponding to the value. In the host monitoring items, it is shown as below:
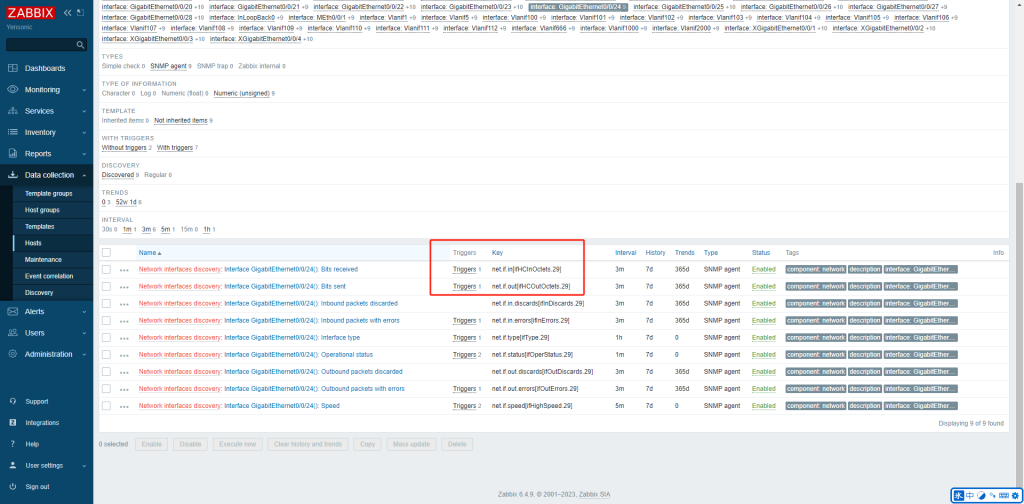
After writing all the device links, you can achieve the effect shown at the beginning of this article.
However, in actual use, it was found that Zabbix, due to using the SNMP protocol, has a long data update cycle. The minimum setting is 1 second, and it cannot display system traffic information at the millisecond level. Therefore, the entire dynamic topology map is not perfect and cannot reflect the system traffic status in real-time.